Category Role Matrix
There are many ways of skinning the Cat, and the ‘Cat Man Grid’ by Dr. Robert Blattberg is yet another classic example of how to evaluate the portfolio according to a ‘2 by 3’ structure. Retail is about utilizing margin and sales - combined with trends and user experience - to optimize value creation and velocity.

The Category Role Matrix (Cat Man Grid)
The Cat Man Grid is a two dimensional model classifying categories or products according to Sales (High - Medium - Low) and GP Margin % (High & Low), ending up with six different roles / zones.
Two Strategic Options
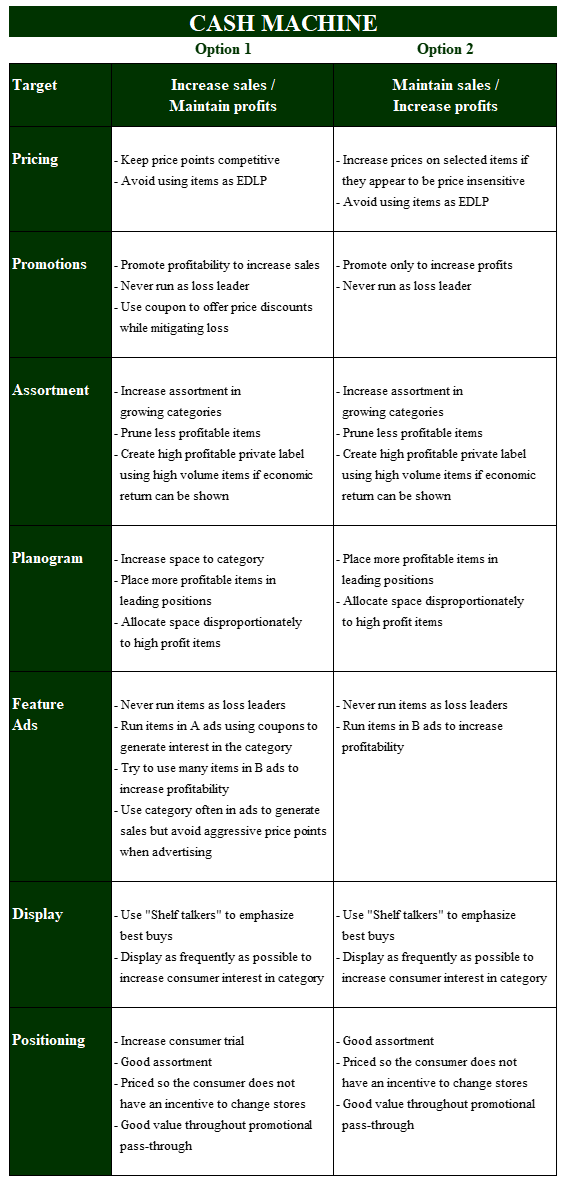
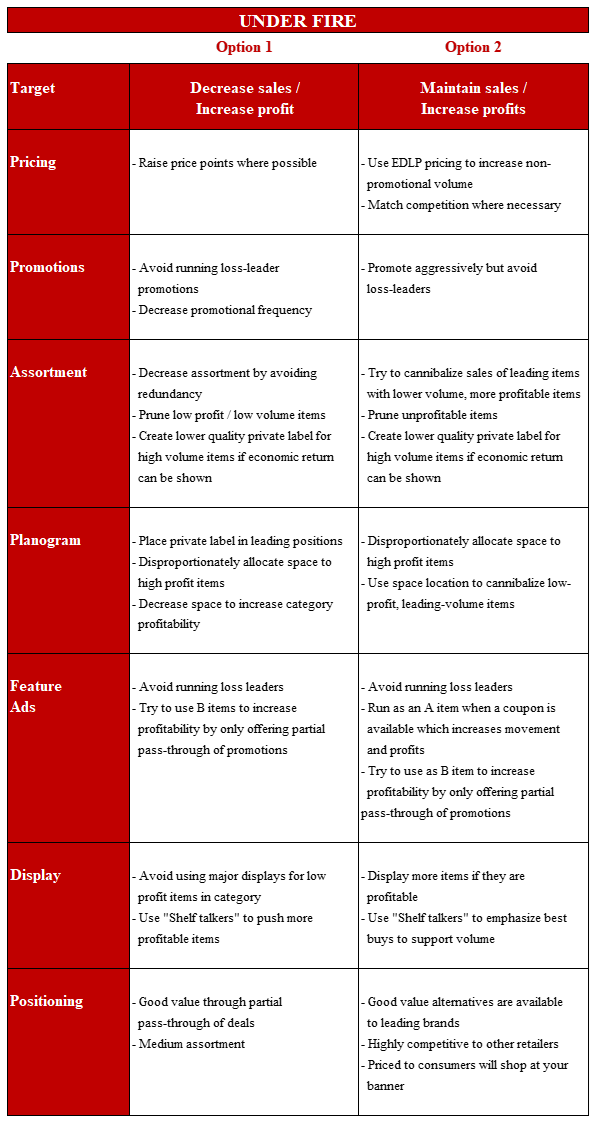
With a two dimensional model like this, you end up with two distinct strategic options:
Increase sales / Maintain margin
Maintain sales / Increase margin
The desired outcome of both strategic directions, is to maximize profit and improve the shares. The most important thing is to look at the model as dynamic instrument. There are several actions to be executed to move along the desired route. All way down in this update, you can see the original thoughts of Dr. Blattberg.
Clear Cut to Minimize Interpretation
Though we very much like the simplicity in the ‘Cat Man Grid’, we also see the negative side. It is a model open for interpretation, as it has no clear cuts for what goes where. In lieu of that, we took it a step further, and included ‘clear cuts’ in terms of GP Margin and Sales %. Based on these clear cut-offs, each role / classification got a ‘score’ for further action.

The Good - The Bad - The Ugly
The check-mark means ‘good to go and develop further’. The question-mark means to ‘track and follow’, whilst the cross-mark means to put on the ‘penalty list’ for potential delisting.
The cut-offs are not cut in stone, and are hence dynamic in nature. They do need to be flexible to be best fit for the respective categories. When evaluating FMCG categories in developed markets, we often use 2.5% and 5.0% for Sales, and 20% for GP Margin. In this case, we have used 1% and 3% for sales, but kept 20% GP Margin.
Going Macro
Every category is part of a bigger picture, and is hence a needful thing to understand before entering into your own battle for assortment optimization, category shares and category placement. This is however at the simplistic transactional level. As you embrace and develop the holistic principles of ‘5-Ways of Selling’, you will step-change the development for your category. It is as it is said: ‘Everything starts with the consumer (or user)’, and their experience with what you offer.

Finding your role (quadrant)
Clear-cuts simplify the positioning of each category in an objective and fair way.
Boxed & Labeled
Though you are brutally ‘boxed & labeled’, according to a defined and set grid; it is up to you to do ‘break free’ and move on. Though it might seems hard or impossible, it is not. There are always tactically- or strategic tools available for this to happen. A tectonic shift does however not happen over night. If you want to move your category from e.g. ‘Core traffic’ (Low Margin & High Sales) to a ‘Flagship’, you can’t copy what you did yesterday. Nor can you copy competition. You simply need to elevate your perspectives and moves.

Playing Chess
Not sure if you’re in the league of Magnus Carlsen or Viswanathan Anand when it comes to Classical Chess, but FMCG-Game Planning is something very different. It has more dimensions and levels into it; compared to the known 10^120 options that chess is offering.
Slimming the assortment the objective way
Products representing less than 1% of the sub-category / segment and has a low margin, stand the risk of be ‘boxed and labeled’ as ‘Rehab’ products. These products consumes a lot of work and space, but when it comes to yield, they are like parasites. There are of course many ifs, buts and maybes, but regardless of those, these products need to be analyzed for further action.

Brutal Facts drive top-line sales and bottom-line profit
Our very own projects spanning two decades and dozens of countries, show that when parasites are removed and Flagships and Cash Machines are nourished, the benefit is averaging 5.5 times the yield of the parasites. The Category Growth is amounting to 47% on average.
In theory it is simple to talk about ‘parasites’ or ‘rehab'-products’, but in reality it is however more complex. Companies do have their PFP-principles or bundle-in SKUs, and Pay for Presence. So weighing industry-money and shopper-money is something we need to leave for retailers to settle. We only look into what is growing out of store sales.
Increasing User Experience (UX)
Regardless of what happens to the poor performing SKUs, the retailer and category captain need to objectively nourish good performing SKUs, through improved UX. We’ve seen many examples of where ‘smart’ retailers hide their flagships, in an attempt to get shoppers to search their desired basket items, and pick up more products along the way. The typical result is a category drop of 30-40%. It is not just a potential lift for the brand alone, but for the overall category.

Nourish and flourish category leaders
Everyone wins when highlighting the category leader, as it is a magnet to the respective category.
Every second counts
By only looking at the primary sales, we often see a substantial growth for the overall category when highlighting the Green-Zone-SKUs. Category leaders and favorite brands are the pillars for the momentum in the category, and for securing the space allocated for the overall category. By reducing the visibility, the retailer run the risk of a total decline. When introducing secondary selling tools (e.g. Conceptual), the overall sales (not only the respective category) will grow exponentially. Fully implemented 5WoS-Projects has been lifting categories 6-24 times compared to pure transactional initiatives.

Let Category Heroes shine
Make the category elegant, relevant and increase the interaction in meters and in seconds, by using category heroes as magnets. The net effect is +3.7% category growth for every 1-second incremental in-line visibility.
The Paradox of Choice
There is a tipping point of when additional SKUs lift the category, or the opposite happens. More and more SKUs often lead sub-optimal solutions and a decline in overall sales. This is the paradox of choice, and it often happens at the 1% of sub-category level. At a 30 minute shopping trip, you will have to deal with 1,500 SKUs per second. The more impressions your brain has to observe during ‘call of duty’, the more the sales will decline.

House-Hold-Basket is at 350 SKUs / year
An average supermarket has doubled the number of SKUs through the last decade, but the average number of SKUs in the house-hold-basket is still at 350 per annum.
Growing the franchise
Blattberg and his team proposed a set of strategies for how to grow each of the six ‘roles’ along the axes of increase sales and maintaining margin, and vice versa. This is however more or less options for how to grow the output in a transactional way. There are many more ways, and especially when you elevate it to also include all 5-Ways of Selling.